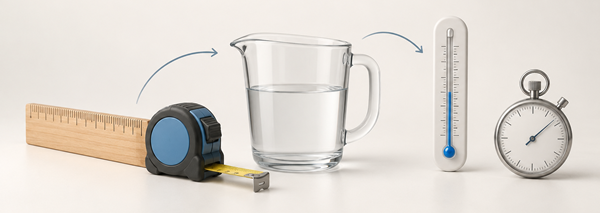
Use this years to decades converter to divide any number of years by 10. Alongside the calculation, discover how weather stations turn daily observations into annual records and how ten years of measurements become one decade of climate data. For example, 10 years equals 1 decade, while 30 years equals 3 decades.
Year to Decade Conversion Formula
The conversion formula is:
1 y = 0.1 Decade
Or simply:
y × 0.1 = Decade
This conversion uses fixed seconds-based factors: 1 y = 31,557,600 s and 1 Decade = 315,576,000 s.
Common Year to Decade Conversions
| Years | Decades |
|---|---|
| 1 year | 0.1 decades |
| 2 years | 0.2 decades |
| 5 years | 0.5 decades |
| 10 years | 1 decade |
| 15 years | 1.5 decades |
| 20 years | 2 decades |
| 25 years | 2.5 decades |
| 30 years | 3 decades |
| 40 years | 4 decades |
| 50 years | 5 decades |
| 60 years | 6 decades |
| 70 years | 7 decades |
| 75 years | 7.5 decades |
| 80 years | 8 decades |
| 90 years | 9 decades |
| 100 years | 10 decades |
| 250 years | 25 decades |
| 500 years | 50 decades |
| 1,000 years | 100 decades |
| 10,000 years | 1,000 decades |
Ten Years of Climate Records Become One Decade of Data
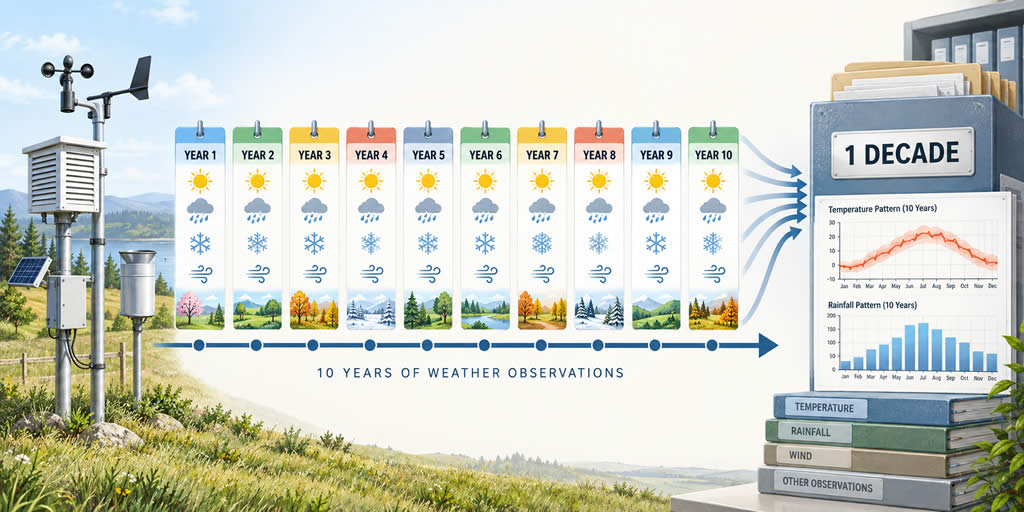
At midnight on 31 December, a weather station completes another year of observations. Its archive may contain thousands of readings covering temperature, rainfall, wind, humidity and air pressure. When this process continues for ten full years, the station has collected one decade of data:
10 years = 1 decade
A years to decade converter performs this conversion by dividing the number of years by 10. Someone searching for a converter years to decade is usually looking for the same simple calculation:
Decades = years ÷ 10
The arithmetic is straightforward. Understanding what ten years of measurements reveal is far more complex.
A Weather Station Builds Its Record One Day at a Time
Imagine a weather station serving a farming community. In its first year, it might record a wet spring and an unusually warm summer. The next year could be cooler, while the third might bring a long dry spell. None of these years alone provides a complete picture of the local climate.
By the end of year ten, researchers can organise the observations into a connected timeline. They can compare annual rainfall totals, count very hot days, examine the timing of the first frost and see whether recent summers differ from those recorded near the beginning of the decade.
NOAA's Climate Data Online provides access to quality‑controlled daily, monthly, seasonal and yearly climate measurements. These different intervals help researchers study individual events as well as long‑term changes.
Why Researchers Compare Decades
Annual weather can vary dramatically. A single hot year may be followed by a cooler one, and one severe storm can make a year's rainfall total appear unusually high. Grouping observations into decades gives researchers a broader view and makes it easier to compare one period with another. As WMO Secretary-General Michel Jarraud put it when introducing a major decadal climate assessment, "a decade is the minimum possible timeframe for meaningful assessments of climate change."
For example, a station might report the following illustrative figures:
| Period | Recorded result |
|---|---|
| Years 1–5 | Average of 12 very hot days per year |
| Years 6–10 | Average of 18 very hot days per year |
| Complete period | 10 years, or 1 decade, of observations |
This comparison might highlight a question worth investigating, but it does not prove the cause of the difference. Researchers must examine data quality, natural variability, changes near the station and records from other locations before drawing conclusions.
One Decade Is Not a Standard Climate Normal
Ten years provide useful context, but they are shorter than the period normally used to define a standard climate reference. The World Meteorological Organization defines climatological standard normals using consecutive 30‑year periods. Three decades are combined to reduce the influence of unusually wet, dry, warm or cool individual years.
NOAA similarly calculates official US Climate Normals over uniform 30‑year periods, currently 1991–2020. These averages help people compare current conditions with a consistent historical baseline rather than treating one recent decade as a complete definition of "normal."
Converting the Length of the Archive
Suppose the station began operating on 1 January 2015 and collected data through 31 December 2024. It completed ten calendar years:
2015–2024 = 10 complete years = 1 decade
If observations continued through 2034, the archive would contain 20 years, or two decades. After 30 years, it would contain three decades — the length of a standard climatological‑normal period.
- 10 years = 1 decade
- 20 years = 2 decades
- 30 years = 3 decades
- 50 years = 5 decades
Converting years to decades changes only how the duration is expressed. It does not identify a trend or explain why conditions changed. The scientific value comes from analysing the measurements carefully and comparing multiple periods, stations and variables.
A decade of climate records is both a unit of time and a chapter in a much longer environmental story. Each daily observation adds another detail; together, ten years of those details help researchers ask better questions about how local conditions vary and evolve.