Enter the expected low and high temperature for a destination in Celsius or Fahrenheit. The planner shows the range in both scales, considers rain, wind, sunshine or snow, and builds a flexible outfit and packing plan for sightseeing, active travel, relaxed trips or an evening event.
The conversion supports the decision rather than ending with a number. A forecast of 8–18 °C becomes 46.4–64.4 °F, but useful preparation also depends on the daily range, weather conditions and activity. The historical British forecast change below explains why presenting both scales side by side remains helpful to travellers.
Visit our temperature conversion hub to explore other temperature units. To convert in the other direction, use the Fahrenheit to Celsius converter.
How the Celsius and Fahrenheit Scales Developed
Early thermometers could show whether something was becoming warmer or colder, but measurements from different instruments were difficult to compare. A useful scale required reproducible reference points, consistently manufactured thermometers and an agreed way of dividing the interval between readings. Two eighteenth-century proposals eventually became the scales most familiar today. Celsius and Fahrenheit measure the same physical quantity, but their zero points and degree sizes came from different historical choices.
Fahrenheit and Repeatable Temperature Readings
Instrument maker Daniel Gabriel Fahrenheit presented the scale bearing his name in 1724. He was also an important developer of sealed liquid-in-glass thermometers and is associated with the early use of mercury as an indicating liquid.
An early version of his scale used a cold salt-and-water mixture as a reference and placed human body temperature near 96 degrees. The scale was later standardised so that water freezes at 32 °F and boils at 212 °F under defined conditions, an interval of 180 Fahrenheit degrees (212 − 32 = 180). NIST gives more background in its history of the kelvin and temperature scales.
Celsius Originally Put Boiling at Zero
Swedish astronomer Anders Celsius proposed his hundred-division scale in 1742. His arrangement ran in the opposite direction from the modern scale: water's boiling point was marked as zero and its freezing point as 100.
The orientation was reversed after Celsius died in 1744. Several scientists and instrument makers have been associated with the ascending version, so the change should not be attributed to one person. In the resulting scale the interval between the traditional freezing and boiling points of water stayed divided into 100 equal degrees.
From Centigrade to Celsius
The scale became widely known as centigrade because the name referred to its one hundred divisions. In 1948, international measurement authorities adopted degree Celsius as its formal name. The decision honoured Anders Celsius and avoided ambiguity because "centigrade" also had meanings outside temperature measurement. It is recorded in the 1948 meeting of the International Committee for Weights and Measures , which adopted the name "degree Celsius".
How British Weather Changed from Fahrenheit to Celsius
Fahrenheit was once the temperature language most familiar in British daily life. Newspapers, household thermometers, recipes and weather forecasts commonly used it. A pleasant summer day might be described as being "in the seventies," while an oven could be set to 350 °F.
The move to Celsius did not happen because Fahrenheit had become inaccurate. It formed part of a broader effort to align British scientific, industrial and public measurements with internationally used metric conventions. Scientists and technical organisations already used Celsius. Public forecasting was harder, because millions of people had learned to associate familiar weather with Fahrenheit numbers.
| Date | What changed |
|---|---|
| 1 January 1961 | The Met Office formally adopts the degree Celsius as its official unit of temperature, following the World Meteorological Organization. |
| 1961 to 1969 | The Met Office issues a printed table for converting degrees Celsius to degrees Fahrenheit (M.O. 689), recorded in its archive. |
| January 1962 | Public forecasts begin to give Celsius equivalents after the Fahrenheit temperatures. |
| 15 October 1962 | Celsius becomes the primary unit in public forecasts, with Fahrenheit equivalents kept for a period of years. |
| 1960s | Temperature symbols on BBC television weather maps use Celsius only. |
| 1970 | Recorded telephone forecasts and several independent television weather presentations switch to Celsius only. |
| By 1971 | The Met Office no longer uses Fahrenheit. |
Why Showing Both Scales Helped
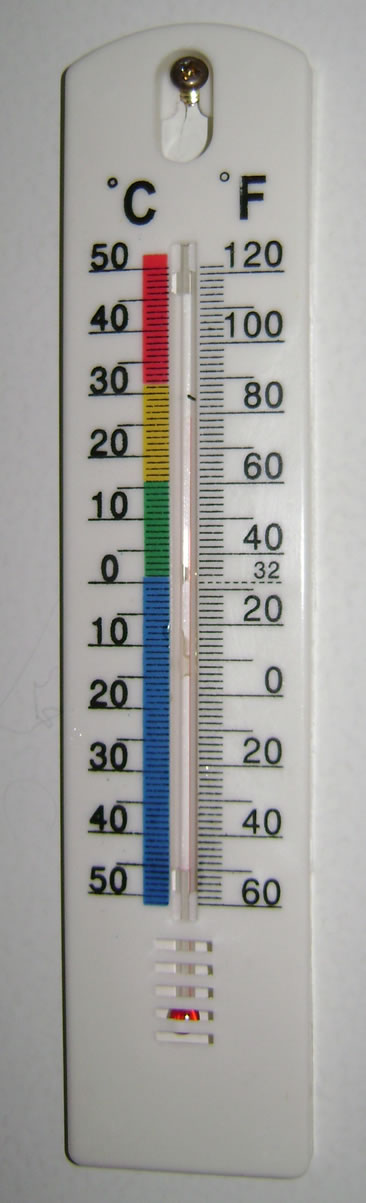
Showing both values let audiences connect familiar conditions with the new scale. A forecast could present 68 °F beside 20 °C, so viewers learned the relationship gradually instead of being asked to convert in their heads. Dual-scale thermometers did the same job in the home: both numbers were visible at the same physical temperature.
Why Fahrenheit Did Not Disappear
Changing the unit in an official forecast is much faster than changing a population's habits. People who had spent decades associating 70 °F with warmth or 90 °F with exceptional heat kept using those expressions in conversation. Metrication UK's survey of the change notes that some media still use both units today and some newspapers use Fahrenheit in headlines.
How to Convert Celsius to Fahrenheit
The two scales have different zero points and differently sized degrees, so the conversion needs both multiplication and addition. Multiply the Celsius value by 9/5, or 1.8, and then add 32:
°F = (°C × 9 ÷ 5) + 32
For example, a forecast of 25 °C converts as follows:
(25 × 1.8) + 32 = 77 °F
Because one Celsius degree is 1.8 Fahrenheit degrees, every 10 °C step adds exactly 18 °F. That gives a set of anchor temperatures that are easy to remember, which is how the 1962 audience learned the new scale.
| Celsius | Fahrenheit | Base outfit the guide suggests for a day averaging this |
|---|---|---|
| −10 °C | 14 °F | A thermal or long-sleeved base layer, warm jumper and insulated coat |
| 0 °C | 32 °F | A long-sleeved top with a jumper or fleece and a medium-weight jacket |
| 10 °C | 50 °F | A breathable top with a light jumper and a light jacket |
| 20 °C | 68 °F | A breathable shirt or T-shirt with lightweight trousers, plus one light layer |
| 30 °C | 86 °F | Loose, lightweight, breathable clothing |
| 35 °C | 95 °F | Very lightweight clothing, with regular breaks in cooler places |
Oven temperatures use the same formula. Recipe conversion charts commonly pair 180 °C with 350 °F, although the exact figure is (180 × 1.8) + 32 = 356 °F.
What Defines Celsius Today?
Introductory explanations often state that water freezes at 0 °C and boils at 100 °C. These remain useful everyday reference values, but the exact phase-change temperatures of water depend on pressure, purity and experimental conditions. Water's boiling point, for example, changes with altitude. Modern Celsius is tied to the kelvin scale: a change of one degree Celsius is exactly the same size as a change of one kelvin, and 0 °C is exactly 273.15 K. The BIPM SI Brochure sets out the definition.
From Dual Forecasts to Dual Packing Lists
The 1962 problem was not only arithmetic. Viewers had to learn what the new numbers meant, and forecasters helped by showing both scales until the new numbers carried meaning on their own.
Travellers face the same problem today. The Met Office now provides forecasts for around 7,000 locations worldwide, and its world forecast guide explains that users can choose Celsius or Fahrenheit under Settings. Its forecasts also give a "feels like" temperature. A UK traveller who meets a US forecast of 47 to 65 °F needs more than the arithmetic (about 8 to 18 °C): they need to know what to pack.
That is what the guide below does. Add the lowest and highest temperature for each day in either scale and it shows both together, as the 1962 forecasts did, then turns the complete forecast into a packing plan. It uses the coldest, warmest and wettest parts of the trip to estimate quantities, useful layers and a practical outfit for every day.
Create a Travel Outfit and Packing Guide from the Forecast
Enter a forecast low and high for each day in Celsius or Fahrenheit, then describe the expected conditions and activity. The planner considers trip length, access to laundry, personal temperature sensitivity and time spent outdoors. It produces packing quantities, one combined tickable checklist and a daily outfit timeline. Preset buttons provide mild, US-format and hot-weather examples.
The suggestions are intended for a generally healthy adult doing ordinary travel or sightseeing. Wind, rain, sunshine, humidity, altitude and personal comfort can make the same air temperature feel very different.
Trip Forecast Summary
Suggested Packing Quantities
Combined Packing Checklist
Daily Outfit Timeline
| Day | Forecast | Morning | Afternoon | Evening and extras |
|---|
Check the latest local forecast, weather warnings and the expected "feels like" temperature before leaving. Children, older travellers and people with health conditions may need different protection. Outfit suggestions are general information, not medical or safety advice.
Sources
- Metrication UK: Weather: the 1961 adoption, the 1962 changes, the 1970 and 1971 milestones and the BBC weather maps.
- Met Office National Meteorological Library and Archive: the Celsius-to-Fahrenheit conversion table M.O. 689 (1961 to 1969).
- Met Office world forecast guide: the 7,000 locations, the "feels like" temperature and the Celsius or Fahrenheit setting.
- BIPM: 42nd meeting of the CIPM (1948) and the SI Brochure: the adoption of "degree Celsius" and the kelvin relationship.
- NIST: history of the kelvin and temperature scales: background on Fahrenheit, Celsius and early thermometers.
The outfit guide is an UnitConversionPlus illustration that turns the temperatures you enter into general packing suggestions. It is not sourced from or endorsed by the organisations above. Figures on this page are checked against the sources listed. Spotted an error? Contact us.